Multi-Strategy Trading Screener SummaryI only combined famous scripts, all thanks to wonderful scripts and community out there .
ThankYou !
------
Core Architecture
Multi-Symbol Analysis: Tracks up to 5 configurable tickers simultaneously
Multi-Timeframe Support: Each symbol can use different timeframes
Real-Time Dashboard: Color-coded table displaying all signals and analysis
Trend Validation: All signals include trend alignment confirmation
Integrated Trading Strategies
1. Breaker Blocks (Order Blocks)
Detects institutional order blocks using swing analysis
Tracks when blocks are broken and become "breaker blocks"
Monitors retests of broken levels
Shows trend alignment (✓ aligned, ⚠️ misaligned)
2. Chandelier Exit
ATR-based trend-following exit system
Provides BUY/SELL signals based on dynamic stop levels
Uses configurable ATR multiplier and lookback period
3. Smart Money Breakout
Channel breakout detection with volatility normalization
Identifies accumulation/distribution phases
Generates persistent BUY/SELL signals on breakouts
4. Trendline Breakout
Dynamic trendline detection using pivot highs/lows
Calculates trendline slopes and breakout points
Provides BUY signals on upward breaks, SELL on downward breaks
Dashboard Columns Explained
Symbol: Ticker being analyzed
Trend: Overall SuperTrend direction (🟢 UP / 🔴 DOWN / ⚪ FLAT)
Timeframe: Analysis timeframe with clock icon
Breaker Block: Type (Bullish/Bearish) with trend alignment indicator
Status: Price position relative to breaker block (Inside/Approaching/Far)
Retests: Number of times the broken level was retested (indicates level strength)
Volume: Volume associated with the order block formation
Chandelier: BUY/SELL signals from Chandelier Exit strategy
Smart Money: BUY/SELL signals from breakout detection
Trendline: BUY/SELL signals from trendline breakouts
Key Features
No HOLD States: All signals show definitive BUY (🟢) or SELL (🔴) only
Persistent Signals: Signals remain active until opposite conditions trigger
Color Coding: Visual distinction between bullish (green) and bearish (red) signals
Trend Alignment: Enhanced accuracy through trend confirmation logic
This screener provides a comprehensive view of market conditions across multiple strategies, helping identify high-probability trading opportunities when signals align.
Search in scripts for "Buy sell"

Continuous Partial Buying Signals v7.1🇬🇧 English Description: Continuous Partial Buying Signals v7.1
This indicator is built on a long-term accumulation philosophy , not a traditional buy-sell strategy. Its main purpose is to systematically increase your position in an asset you believe in by identifying significant price drops as buying opportunities. It is a tool designed for long-term investors who want to automate the "buy the dip" or "Dollar Cost Averaging (DCA)" mindset.
How It Works
The logic follows a simple but powerful cycle: Find a Peak -> Wait for a Drop -> Signal a Buy -> Wait for a New Peak.
1. Identifies a Significant Peak: Instead of reacting to minor price spikes, the indicator looks back over a user-defined period (e.g., the last 200 candles) to find the highest price. This stable peak (marked with an orange circle) becomes the reference point for the current cycle.
2. Waits for a Pullback: The indicator then calculates the percentage drop from this locked-in peak.
3. Generates Buy Signals: When the price drops by the percentages you define (e.g., -5% and -10%), it plots a "BUY" signal on the chart. It will only signal once per level within the same cycle.
4. Resets the Cycle: This is the key. If the price recovers and establishes a new significant peak higher than the previous one, the entire cycle resets. The new peak becomes the new reference, and the buy signals are re-armed, allowing the indicator to perpetually find new buying opportunities in a rising market.
How to Get the Most Out of This Indicator
* Timeframe: It is highly recommended to use this on higher timeframes (4H, Daily, Weekly) to align with its long-term accumulation philosophy.
* Peak Lookback Period:
* Higher values (200, 300): Create more stable and less frequent signals. Ideal for long-term, patient investors.
* Lower values (50, 100): More sensitive to recent price action, resulting in more frequent cycles.
* Drop Percentages: Adjust these based on the asset's volatility.
* Volatile assets (Crypto): Consider larger percentages like 10%, 20%.
* Less volatile assets (Stocks, Indices): Smaller percentages like 3%, 5%, 8% might be more appropriate.
This indicator is a tool for disciplined, emotion-free accumulation. It does not provide sell signals.

Table Logic ExtractorTable Logic Extractor v2.0
Advanced multi-timeframe analysis with intelligent trade recommendations!
Overview:
This sophisticated indicator provides comprehensive market analysis through multiple technical indicators and timeframes. It combines EMA analysis, RSI momentum, MACD signals, Bollinger Bands, volume analysis, divergence detection, and intelligent trade recommendations with support/resistance distance calculations and trading style detection.
Key Features:
✅ Multi-Indicator Analysis - EMA, RSI, MACD, Bollinger Bands, Volume, ATR
✅ Multi-Timeframe Analysis - M1, M5, M15, M30 trend comparison
✅ Divergence Detection - Bullish and bearish divergence with strength calculation
✅ Support/Resistance Analysis - Distance calculations with Fibonacci levels
✅ Trading Style Detection - Trend, Range, Breakout, Scalping identification
✅ Intelligent Trade Signals - Style-based trade recommendations with confidence levels
✅ Risk Management - Stop Loss and Take Profit calculations
✅ Comprehensive Table - Real-time analysis with 14 different metrics
How It Works:
The indicator uses advanced analysis:
• Multi-Timeframe - M1, M5, M15, M30 trend analysis
• Style Detection - Automatic trading style identification
• S/R Analysis - Fibonacci-based support/resistance levels
• Weighted Scoring - EMA (2.0), RSI (1.5), MACD (1.5), BB (1.0), Volume (1.0)
• Intelligent Signals - Style-based trade recommendations
Trading Style Detection:
• TREND TRADING - Strong trend + aligned timeframes (Green)
• RANGE TRADING - Low volatility + sideways movement (Yellow)
• BREAKOUT TRADING - High volume + near levels (Orange)
• SCALPING - High volatility + quick moves (Red)
Information Table (14 Metrics):
Real-time display showing:
• ATR volatility with signal (HIGH/MED/LOW/NORMAL VOL)
• Divergence status with strength percentage
• S/R Distance with Fibonacci levels
• Stop Loss (2.0:1 ratio) and Take Profit 1 (1.5:1 ratio)
• Multi-Timeframe analysis (M1, M5, M15, M30)
• Scalping signals with confidence levels
• Current trend with strength percentage
• Intelligent trade recommendations
Trade Recommendations:
• TREND BUY/SELL - All timeframes aligned (High confidence)
• SHORT-TERM BUY/SELL - M5 signal only (Medium confidence)
• SCALPING BUY/SELL - M5 vs higher timeframes (Low confidence)
• WAIT - No clear signal (No confidence)
Support/Resistance Analysis:
• Fibonacci Levels: 23.6%, 38.2%, 50% retracements
• Distance Categories: Very Near (Red), Near (Orange), Medium (Yellow), Far (Green)
• ATR-based distance measurement
• Real-time proximity alerts
Scalping Detection:
Specialized signals based on:
• High volatility (ATR ratio > 1.5)
• Quick price moves (fast momentum)
• Volume confirmation (high volume spikes)
• RSI extremes (oversold/overbought)
Settings:
• EMA - Fast (9), Slow (21), Trend (50)
• RSI - Length (14), Overbought (70), Oversold (30)
• MACD - Fast (12), Slow (26), Signal (9)
• Bollinger Bands - Length (20), Multiplier (2.0)
• ATR - Length (14) for volatility measurement
• Volume Threshold - 1.5x average volume
• Divergence - Lookback (3), Threshold (0.5)
Best Practices:
🎯 Adapt strategy to detected trading style
📊 Use multi-timeframe analysis for confirmation
⚡ Monitor S/R distances for entry timing
🛡️ Always use calculated Stop Loss levels
🔍 Watch for divergence signals
📈 Follow intelligent trade recommendations
Pro Tips:
• Table provides all essential information in one place
• Trading style detection helps adapt your strategy
• S/R distance shows proximity to key levels
• Confidence levels indicate signal reliability
• Multi-timeframe alignment increases success rate
• Scalping signals work best in high volatility
Alerts:
• Trend Change Alert - "Trend changed across timeframes"
• Divergence Alert - "Divergence detected"
• Scalping Alert - "Scalping opportunity"
• Trade Signal Alert - "Trade recommendation available"
Version 2.0 Improvements:
• Advanced multi-timeframe analysis (M1, M5, M15, M30)
• Intelligent trading style detection
• Comprehensive support/resistance analysis
• Professional trade recommendations with confidence levels
• Scalping detection with specialized signals
• Risk management with calculated SL/TP levels
• 14-metric comprehensive information table
Created with ❤️ for the trading community
This indicator is free to use for both commercial and non-commercial purposes.

Complexity v3.2Complex Trend Analyzer v6.1 v3.2
Advanced multi-indicator trend analysis with dynamic timeframe adaptation!
Overview:
This sophisticated indicator combines multiple technical analysis tools for comprehensive trend analysis. It features EMA crossovers, RSI momentum, MACD signals, Bollinger Bands, volume analysis, divergence detection, and multi-timeframe analysis with dynamic parameter adaptation based on market volatility.
Key Features:
✅ Multi-Indicator Analysis - EMA, RSI, MACD, Bollinger Bands, Volume, ATR
✅ Divergence Detection - Bullish and bearish divergence with strength calculation
✅ Dynamic Timeframe Adaptation - Parameters adjust automatically based on timeframe
✅ Trend Tracking - Complete trend lifecycle with BUY/SELL/END signals
✅ Multi-Timeframe Analysis - M5, M15, M30 trend comparison
✅ Risk Management - Volatility filtering and warning system
✅ Visual Clarity - Clean labels, trend lines, and information table
How It Works:
The indicator uses a weighted scoring system:
• EMA (2.0) - Primary trend direction
• RSI (1.5) - Momentum confirmation
• MACD (1.5) - Trend momentum
• Bollinger Bands (1.0) - Volatility context
• Volume (1.0) - Volume confirmation
• Price Action (0.5 each) - Higher highs/lows
Signal Logic:
• BUY - Weighted score > threshold + filters passed
• SELL - Weighted score > threshold + filters passed
• END - Trend reversal conditions met
Visual Elements:
• 🟢 BUY - Green label with trend tracking
• 🔴 SELL - Red label with trend tracking
• ⚫ END - Gray label marking trend end
• × BUY - Green crosses for bullish divergence
• × SELL - Red crosses for bearish divergence
• ⚠️ - Warning signals for trend reversals
Information Table:
Real-time display showing:
• ATR volatility with signal (HIGH/MED/LOW/NORMAL VOL)
• Divergence status with strength percentage
• BUY/SELL signal count and overall signal
• Multi-Timeframe analysis (M5, M15, M30)
• Current trend with strength percentage
• Detailed trend strength analysis
Dynamic Adaptation:
Parameters automatically adjust based on timeframe:
• M1 - Fastest reaction (1.5-7.5 bars)
• M3 - Quick response (2-10 bars)
• M5 - Standard setting (3-15 bars)
• M15 - Slower, more reliable (4-20 bars)
Settings:
• EMA - Fast (9), Slow (21), Trend (50)
• RSI - Length (14), Overbought (70), Oversold (30)
• MACD - Fast (12), Slow (26), Signal (9)
• Bollinger Bands - Length (20), Multiplier (2.0)
• ATR - Length (14) for volatility measurement
• Volume Threshold - 1.5x average volume
Best Practices:
🎯 Works best in trending markets
📊 Use as overlay on main chart
⚡ Combine with price action analysis
🛡️ Always use proper risk management
🔍 Watch for divergence signals
⚠️ Pay attention to warning signals
Pro Tips:
• Green background = Strong uptrend, Red background = Strong downtrend
• Orange background = Risk zone (high volatility/RSI extremes)
• × marks indicate divergence opportunities
• ⚠️ warnings signal potential trend reversals
• Use multi-timeframe analysis for confirmation
• Monitor the information table for comprehensive market view
Alerts:
• BUY Alert - "BUY signal detected"
• SELL Alert - "SELL signal detected"
• Divergence Alert - "Divergence detected"
• Warning Alert - "Trend warning"
Version 3.2 Improvements:
• Enhanced multi-indicator analysis
• Improved divergence detection with strength calculation
• Advanced dynamic timeframe adaptation
• Comprehensive risk management system
• Professional visual presentation
• Weighted scoring system for better accuracy
Created with ❤️ for the trading community
This indicator is free to use for both commercial and non-commercial purposes.

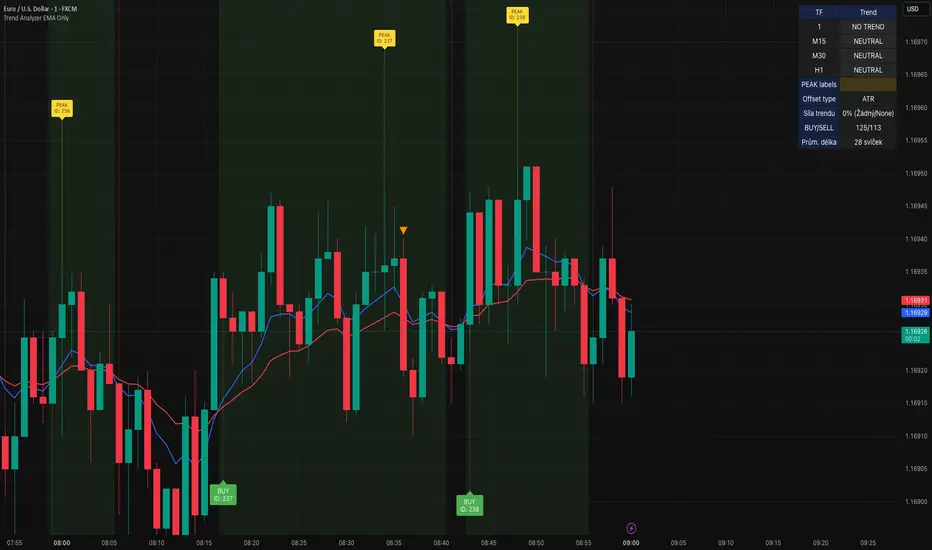
Trend Analyzer v0.6Trend Analyzer EMA Only v0.6
Simple yet powerful EMA trend analysis with multi-timeframe support!
Overview:
This comprehensive indicator focuses on EMA-based trend analysis with clean visual presentation. It provides clear BUY/SELL signals, trend tracking with unique IDs, peak detection, and multi-timeframe analysis across M15, M30, and H1 timeframes.
Key Features:
✅ EMA Trend Analysis - Fast and Slow EMA crossover signals
✅ Trend Tracking - Unique trend IDs with start/end markers
✅ Peak Detection - Automatic peak identification during trends
✅ Multi-Timeframe - Analysis across M15, M30, and H1 timeframes
✅ Visual Clarity - Dotted lines connecting labels to candles
✅ Statistics - BUY/SELL count and average trend length
How It Works:
The indicator calculates signal strength using weighted analysis:
• MACD (50%) - Primary trend momentum
• RSI (30%) - Overbought/oversold conditions
• Volume (20%) - Volume confirmation
Signal Logic:
• BUY - Fast EMA crosses above Slow EMA + both slopes positive
• SELL - Fast EMA crosses below Slow EMA + both slopes negative
• NEUTRAL - EMAs too close (below threshold)
Visual Elements:
• 🟢 BUY - Green label with trend ID
• 🔴 SELL - Red label with trend ID
• ⚪ NEUTRAL - Gray label with trend ID
• 🟡 PEAK - Yellow label marking trend extremes
• ⚫ END - Gray label marking trend end
Information Table:
Real-time display showing:
• Current Timeframe trend state
• Multi-Timeframe analysis (M15, M30, H1)
• PEAK Labels status
• Offset Type configuration
• Trend Strength percentage
• Statistics (BUY/SELL count, average trend length)
Settings:
• Fast EMA Length - 9 (default)
• Slow EMA Length - 21 (default)
• Min Trend Bars - 3 (filters short trends)
• Label Offset Type - ATR, % of price, or Dynamic
• Show PEAK Labels - On/Off toggle
Best Practices:
🎯 Works best in trending markets
📊 Use as overlay on main chart
⚡ Combine with price action analysis
🛡️ Always use proper risk management
Pro Tips:
• Green background = Strong uptrend, Red background = Strong downtrend
• Watch for trend change arrows for early reversal signals
• Use the information table for quick market assessment
• Monitor trend statistics for market behavior insights
Alerts:
• BUY Alert - "BUY signal detected"
• SELL Alert - "SELL signal detected"
Version 0.6 Improvements:
• Optimized performance
• Enhanced visual clarity
• Improved multi-timeframe analysis
• Refined trend detection algorithms
Created with ❤️ for the trading community
This indicator is free to use for both commercial and non-commercial purposes.
Composite Time ProfileComposite Time Profile Overlay (CTPO) - Market Profile Compositing Tool
Automatically composite multiple time periods to identify key areas of balance and market structure
What is the Composite Time Profile Overlay?
The Composite Time Profile Overlay (CTPO) is a Pine Script indicator that automatically composites multiple time periods to identify key areas of balance and market structure. It's designed for traders who use market profile concepts and need to quickly identify where price is likely to find support or resistance.
The indicator analyzes TPO (Time Price Opportunity) data across different timeframes and merges overlapping profiles to create composite levels that represent the most significant areas of balance. This helps you spot where institutional traders are likely to make decisions based on accumulated price action.
Why Use CTPO for Market Profile Trading?
Eliminate Manual Compositing Work
Instead of manually drawing and compositing profiles across different timeframes, CTPO does this automatically. You get instant access to composite levels without spending time analyzing each individual period.
Spot Areas of Balance Quickly
The indicator highlights the most significant areas of balance by compositing overlapping profiles. These areas often act as support and resistance levels because they represent where the most trading activity occurred across multiple time periods.
Focus on What Matters
Rather than getting lost in individual session profiles, CTPO shows you the composite levels that have been validated across multiple timeframes. This helps you focus on the levels that are most likely to hold.
How CTPO Works for Market Profile Traders
Automatic Profile Compositing
CTPO uses a proprietary algorithm that:
- Identifies period boundaries based on your selected timeframe (sessions, daily, weekly, monthly, or auto-detection)
- Calculates TPO profiles for each period using the C2M (Composite 2 Method) row sizing calculation
- Merges overlapping profiles using configurable overlap thresholds (default 50% overlap required)
- Updates composite levels as new price action develops in real-time
Key Levels for Market Profile Analysis
The indicator displays:
- Value Area High (VAH) and Value Area Low (VAL) levels calculated from composite TPO data
- Point of Control (POC) levels where most trading occurred across all composited periods
- Composite zones representing areas of balance with configurable transparency
- 1.618 Fibonacci extensions for breakout targets based on composite range
Multiple Timeframe Support
- Sessions: For intraday market profile analysis
- Daily: For swing trading with daily profiles
- Weekly: For position trading with weekly structure
- Monthly: For long-term market profile analysis
- Auto: Automatically selects timeframe based on your chart
Trading Applications for Market Profile Users
Support and Resistance Trading
Use composite levels as dynamic support and resistance zones. These levels often hold because they represent areas where significant trading decisions were made across multiple timeframes.
Breakout Trading
When composite levels break, they often lead to significant moves. The indicator calculates 1.618 Fibonacci extensions to give you clear targets for breakout trades.
Mean Reversion Strategies
Value Area levels represent the price range where most trading activity occurred. These levels often act as magnets, drawing price back when it moves too far from the mean.
Institutional Level Analysis
Composite levels represent areas where institutional traders have made significant decisions. These levels often hold more weight than traditional technical analysis levels because they're based on actual trading activity.
Key Features for Market Profile Traders
Smart Compositing Logic
- Automatic overlap detection using price range intersection algorithms
- Configurable overlap thresholds (minimum 50% overlap required for merging)
- Dead composite identification (profiles that become engulfed by newer composites)
- Real-time updates as new price action develops using barstate.islast optimization
Visual Customization
- Customizable colors for active, broken, and dead composites
- Adjustable transparency levels for each composite state
- Premium/Discount zone highlighting based on current price vs composite range
- TPO aggression coloring using TPO distribution analysis to identify buying/selling pressure
- Fibonacci level extensions with 1.618 target calculations based on composite range
Clean Chart Presentation
- Only shows the most relevant composite levels (maximum 10 active composites)
- Eliminates clutter from individual session profiles
- Focuses on areas of balance that matter most to current price action
Real-World Trading Examples
Day Trading with Session Composites
Use session-based composites to identify intraday areas of balance. The VAH and VAL levels often act as natural profit targets and stop-loss levels for scalping strategies.
Swing Trading with Daily Composites
Daily composites provide excellent swing trading levels. Look for price reactions at composite zones and use the 1.618 extensions for profit targets.
Position Trading with Weekly Composites
Weekly composites help identify major trend changes and long-term areas of balance. These levels often hold for months or even years.
Risk Management
Composite levels provide natural stop-loss levels. If a composite level breaks, it often signals a significant shift in market sentiment, making it an ideal place to exit losing positions.
Why Composite Levels Work
Composite levels work because they represent areas where significant trading decisions were made across multiple timeframes. When price returns to these levels, traders often remember the previous price action and make similar decisions, creating self-fulfilling prophecies.
The compositing process uses a proprietary algorithm that ensures only levels validated across multiple time periods are displayed. This means you're looking at levels that have proven their significance through actual market behavior, not just random technical levels.
Technical Foundation
The indicator uses TPO (Time Price Opportunity) data combined with price action analysis to identify areas of balance. The C2M row sizing method ensures accurate profile calculations, while the overlap detection algorithm (minimum 50% price range intersection) ensures only truly significant composites are displayed. The algorithm calculates row size based on ATR (Average True Range) divided by 10, then converts to tick size for precise level calculations.
How the Code Actually Works
1. Period Detection and ATR Calculation
The code first determines the appropriate timeframe based on your chart:
- 1m-5m charts: Session-based profiles
- 15m-2h charts: Daily profiles
- 4h charts: Weekly profiles
- 1D charts: Monthly profiles
For each period type, it calculates the number of bars needed for ATR calculation:
- Sessions: 540 minutes divided by chart timeframe
- Daily: 1440 minutes divided by chart timeframe
- Weekly: 7 days worth of minutes divided by chart timeframe
- Monthly: 30 days worth of minutes divided by chart timeframe
2. C2M Row Size Calculation
The code calculates True Range for each bar in the determined period:
- True Range = max(high-low, |high-prevClose|, |low-prevClose|)
- Averages all True Range values to get ATR
- Row Size = (ATR / 10) converted to tick size
- This ensures each TPO row represents a meaningful price movement
3. TPO Profile Generation
For each period, the code:
- Creates price levels from lowest to highest price in the range
- Each level is separated by the calculated row size
- Counts how many bars touch each price level (TPO count)
- Finds the level with highest count = Point of Control (POC)
- Calculates Value Area by expanding from POC until 68.27% of total TPO blocks are included
4. Overlap Detection Algorithm
When a new profile is created, the code checks if it overlaps with existing composites:
- Calculates overlap range = min(currentVAH, prevVAH) - max(currentVAL, prevVAL)
- Calculates current profile range = currentVAH - currentVAL
- Overlap percentage = (overlap range / current profile range) * 100
- If overlap >= 50%, profiles are merged into a composite
5. Composite Merging Logic
When profiles overlap, the code creates a new composite by:
- Taking the earliest start bar and latest end bar
- Using the wider VAH/VAL range (max of both profiles)
- Keeping the POC from the profile with more TPO blocks
- Marking the composite as "active" until price breaks through
6. Real-Time Updates
The code uses barstate.islast to optimize performance:
- Only recalculates on the last bar of each period
- Updates active composite with live price action if enabled
- Cleans up old composites to prevent memory issues
- Redraws all visual elements from scratch each bar
7. Visual Rendering System
The code uses arrays to manage drawing objects:
- Clears all lines/boxes arrays on every bar
- Iterates through composites array to redraw everything
- Uses different colors for active, broken, and dead composites
- Calculates 1.618 Fibonacci extensions for broken composites
Getting Started with CTPO
Step 1: Choose Your Timeframe
Select the period type that matches your trading style:
- Use "Sessions" for day trading
- Use "Daily" for swing trading
- Use "Weekly" for position trading
- Use "Auto" to let the indicator choose based on your chart timeframe
Step 2: Customize the Display
Adjust colors, transparency, and display options to match your charting preferences. The indicator offers extensive customization options to ensure it fits seamlessly into your existing analysis.
Step 3: Identify Key Levels
Look for:
- Composite zones (blue boxes) - major areas of balance
- VAH/VAL lines - value area boundaries
- POC lines - areas of highest trading activity
- 1.618 extension lines - breakout targets
Step 4: Develop Your Strategy
Use these levels to:
- Set entry points near composite zones
- Place stop losses beyond composite levels
- Take profits at 1.618 extension levels
- Identify trend changes when major composites break
Perfect for Market Profile Traders
If you're already using market profile concepts in your trading, CTPO eliminates the manual work of compositing profiles across different timeframes. Instead of spending time analyzing each individual period, you get instant access to the composite levels that matter most.
The indicator's automated compositing process ensures you're always looking at the most relevant areas of balance, while its real-time updates keep you informed of changes as they happen. Whether you're a day trader looking for intraday levels or a position trader analyzing long-term structure, CTPO provides the market profile intelligence you need to succeed.
Streamline Your Market Profile Analysis
Stop wasting time on manual compositing. Let CTPO do the heavy lifting while you focus on executing profitable trades based on areas of balance that actually matter.
Ready to Streamline Your Market Profile Trading?
Add the Composite Time Profile Overlay to your charts today and experience the difference that automated profile compositing can make in your trading performance.

30 Min Pivot Enhanced# 30 Min Pivot Enhanced
The **30 Min Pivot Enhanced** indicator detects pivot reversals and potential buy/sell signals on the 30-minute timeframe. It combines streak-based trend exhaustion with pivot breakouts and optional flush (capitulation) candle detection.
## Core Logic
- Trend streaks: pivots form after consecutive same-color candles (`trendLength`)
- Flush detection: oversized red candles (ATR based) flagged as potential exhaustion
- Pivot candidates:
- Bullish → after a red streak (or flush) followed by a green candle
- Bearish → after a green streak followed by a red candle
- Confirmation: price must break pivot high/low within `maxBarsAfterPivot`
## Inputs
- Consecutive Trend Candles → streak length required for pivot
- Maximum Bars After Pivot → confirmation window
- Show Pivot Lines → toggle pivot levels on chart
- Flush Detection → ATR-based capitulation detection
- Flush Lookback → how many bars to keep flush valid
- Enable Buy/Sell Alerts → toggle trade alerts
## Visuals
- Buy pivots → green "P Buy" labels under price
- Sell pivots → red pivot lines at lows (if enabled)
- Flush markers → optional debug labels showing capitulation bars
## Alerts
- Buy Alert → price breaks above pivot high
- Sell Alert → price breaks below pivot low
---
Best for traders watching **30-minute reversal plays**, especially where exhaustion or flush candles precede a breakout.

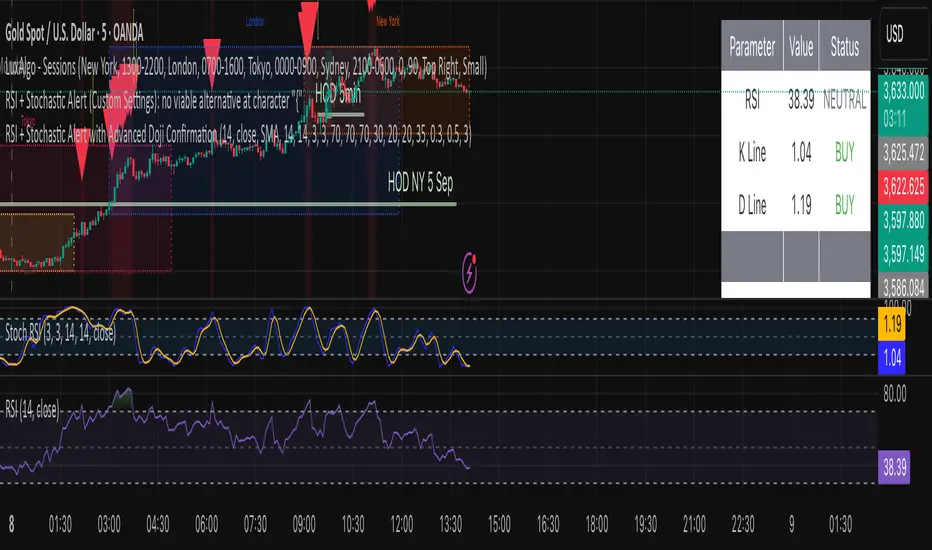
by A.Alasfoor RSI + Stochastic Alert with Doji Confirmationa buy and sell signals upon :
1- Sell : red hammer break (lower body) of 5min , ensure the wick is equal to or longer than the red body range.
2- Buy: Green hammer (upper body) break of 5min , ensure the wick is equal to or longer than the red body range.
Trigger buy/sell upon the break clean at 1min of the body closing level, risking (SL) the earlier 1 min tops/lows.
Credits to Ahmed Alasfoor & Zakariya Hamad AlJulandani by Sumou Oman
Volumatic Fair Value Gaps [BigBeluga]🔵 OVERVIEW
The Volumatic Fair Value Gaps indicator detects and plots size-filtered Fair Value Gaps (FVGs) and immediately analyzes the bullish vs. bearish volume composition inside each gap. When an FVG forms, the tool samples volume from a 10× lower timeframe , splits it into Buy and Sell components, and overlays two compact bars whose percentages always sum to 100%. Each gap also shows its total traded volume . A live dashboard (top-right) summarizes how many bullish and bearish FVGs are currently active and their cumulative volumes—offering a quick read on directional participation and trend pressure.
🔵 CONCEPTS
FVGs (Fair Value Gaps) : Imbalance zones between three consecutive candles where price “skips” trading. The script plots bullish and bearish gaps and extends them until mitigated.
Size Filtering : Only significant gaps (by relative size percentile) are drawn, reducing noise and emphasizing meaningful imbalances.
// Gap Filters
float diff = close > open ? (low - high ) / low * 100 : (low - high) / high *100
float sizeFVG = diff / ta.percentile_nearest_rank(diff, 1000, 100) * 100
bool filterFVG = sizeFVG > 15
Volume Decomposition : For each FVG, the indicator inspects a 10× lower timeframe and aggregates volume of bullish vs. bearish candles inside the gap’s span.
100% Split Bars : Two inline bars per FVG display the % Bull and % Bear shares; their total is always 100%.
Total Gap Volume : A numeric label at the right edge of the FVG shows the total traded volume associated with that gap.
Mitigation Logic : Gaps are removed when price closes through (or touches via high/low—user-selectable) the opposite boundary.
Dashboard Summary : Counts and sums the active bullish/bearish FVGs and their total volumes to gauge directional dominance.
🔵 FEATURES
Bullish & Bearish FVG plotting with independent color controls and visibility toggles.
Adaptive size filter (percentile-based) to keep only impactful gaps.
Lower-TF volume sampling at 10× faster resolution for more granular Buy/Sell breakdown.
Per-FVG volume bars : two horizontal bars showing Bull % and Bear % (sum = 100%).
Per-FVG total volume label displayed at the right end of the gap’s body.
Mitigation source option : choose close or high/low for removing/invalidating gaps.
Overlap control : older overlapped gaps are cleaned to avoid clutter.
Auto-extension : active gaps extend right until mitigated.
Dashboard : shows count of bullish/bearish gaps on chart and cumulative volume totals for each side.
Performance safeguards : caps the number of active FVG boxes to maintain responsiveness.
🔵 HOW TO USE
Turn on/off FVG types : Enable Bullish FVG and/or Bearish FVG depending on your focus.
Tune the filter : The script already filters by relative size; if you need fewer (stronger) signals, increase the percentile threshold in code or reduce the number of displayed boxes.
Choose mitigation source :
close — stricter; gap is removed when a closing price crosses the boundary.
high/low — more sensitive; a wick through the boundary mitigates the gap.
Read the per-FVG bars :
A higher Bull % inside a bullish gap suggests constructive demand backing the imbalance.
A higher Bear % inside a bearish gap suggests supply is enforcing the imbalance.
Use total gap volume : Larger totals imply more meaningful interest at that imbalance; confluence with structure/HTF levels increases relevance.
Watch the dashboard : If bullish counts and cumulative volume exceed bearish, market pressure is likely skewed upward (and vice versa). Combine with trend tools or market structure for entries/exits.
Optional: hide volume bars : Disable Volume Bars when you want a cleaner FVG map while keeping total volume labels and the dashboard.
🔵 CONCLUSION
Volumatic Fair Value Gaps blends precise FVG detection with lower-timeframe volume analytics to show not only where imbalances exist but also who powers them. The per-gap Bull/Bear % bars, total volume labels, and the cumulative dashboard together provide a fast, high-signal read on directional participation. Use the tool to prioritize higher-quality gaps, align with trend bias, and time mitigations or continuations with greater confidence.

Technical Summary VWAP | RSI | VolatilityTechnical Summary VWAP | RSI | Volatility
The Quantum Trading Matrix is a multi-dimensional market-analysis dashboard designed as an educational and idea-generation tool to help traders read price structure, participation, momentum and volatility in one compact view. It is not an automated execution system; rather, it aggregates lightweight “quantum” signals — VWAP position, momentum oscillator behaviour, multi-EMA trend scoring, volume flow and institutional activity heuristics, market microstructure pivots and volatility measures — and synthesizes them into a single, transparent score and signal recommendation. The primary goal is to make explicit why a given market looks favourable or unfavourable by showing the individual ingredients and how they combine, enabling traders to learn, test and form rules based on observable market mechanics.
Each module of the matrix answers a distinct market question. VWAP and its percentage distance indicate whether the current price is trading above or below the intraday volume-weighted average — a proxy for intraday institutional control and value. The quantum momentum oscillator (fast and slow EMA difference scaled to percent) captures short-to-intermediate momentum shifts, providing a quickly responsive view of directional pressure. Multi-EMA trend scoring (8/21/50) produces a simple, transparent trend score by counting conditions such as price above EMAs and cross-EMAs ordering; this score is used to categorize market trend into descriptive buckets (e.g., STRONG UP, WEAK UP, NEUTRAL, DOWN). Volume analysis compares current volume to a recent moving average and computes a Z-score to detect spikes and unusual participation; additional buy/sell pressure heuristics (buyingPressure, sellingPressure, flowRatio) estimate whether upside or downside participation dominates the bar. Institutional activity is approximated by flagging large orders relative to volume baseline (e.g., volume > 2.5× MA) and estimating a dark pool proxy; this is a heuristic to highlight bars that likely had large players involved.
The dashboard also performs market-structure detection with small pivot windows to identify recent local support/resistance areas and computes price position relative to the daily high/low (dailyMid, pricePosition). Volatility is measured via ATR divided by price and bucketed into LOW/NORMAL/HIGH/EXTREME categories to help you adapt stop sizing and expectational horizons. Finally, all these pieces feed an interpretable scoring function that rewards alignment: VWAP above, strong flow ratio, bullish trend score, bullish momentum, and favorable RSI zone add to the overall score which is presented as a 0–100 metric and a colored emoji indicator for at-a-glance assessment.
The mashup is purposeful: each indicator covers a failure mode of the other. For example, momentum readings can be misleading during volatility spikes; VWAP informs whether institutions are on the bid or offer; volume Z-score detects abnormal participation that can validate a breakout; multi-EMA score mitigates single-EMA whipsaws by requiring a combination of price/EMA conditions. Combining these signals increases information content while keeping each component explainable — a key compliance requirement. The script intentionally emphasizes transparency: when it shows a BUY/SELL/HOLD recommendation, the dashboard shows the underlying sub-components so a trader can see whether VWAP, momentum, volume, trend or structure primarily drove the score.
For practical use, adopt a clear workflow: (1) check the matrix score and read the component tiles (VWAP position, momentum, trend and volume) to understand the drivers; (2) confirm market-structure support/resistance and pricePosition relative to the daily range; (3) require at least two corroborating components (for example, VWAP ABOVE + Momentum BULLISH or Volume spike + Trend STRONG UP) before considering entries; (4) use ATR-based stops or daily pivot distance for stop placement and size positions such that the trade risks a small, pre-defined percent of capital; (5) for intraday scalps shorten holding time and tighten stops, for swing trades increase lookback lengths and require multi-timeframe (higher TF) agreement. Treat the matrix as an idea filter and replay lab: when an alert triggers, replay the bars and observe which components anticipated the move and which lagged.
Parameter tuning matters. Shortening the momentum length makes the oscillator more sensitive (useful for scalping), while lengthening it reduces noise for swing contexts. Volume profile bars and MA length should match the instrument’s liquidity — increase the MA for low-liquidity stocks to reduce false institutional flags. The trend multiplier and signal sensitivity parameters let you calibrate how aggressively the matrix counts micro evidence into the score. Always backtest parameter sets across multiple periods and instruments; run walk-forward tests and keep a simple out-of-sample validation window to reduce overfitting risk.
Limitations and failure modes are explicit: institutional flags and dark-pool estimates are heuristics and cannot substitute for true tape or broker-level order flow; volume split by price range is an approximation and will not perfectly reflect signed volume; pivot detection with small windows may miss larger structural swings; VWAP is typically intraday-centric and less meaningful across multi-day swing contexts; the score is additive and may not capture non-linear relationships between features in extreme market regimes (e.g., flash crashes, circuit breaker events, or overnight gaps). The matrix is also susceptible to false signals during major news releases when price and volume behavior dislocate from typical patterns. Users should explicitly test behavior around earnings, macro data and low-liquidity periods.
To learn with the matrix, perform these experiments: (A) collect all BUY/SELL alerts over a 6-month period and measure median outcome at 5, 20 and 60 bars; (B) require additional gating conditions (e.g., only accept BUY when flowRatio>60 and trendScore≥4) and compare expectancy; (C) vary the institutional threshold (2×, 2.5×, 3× volumeMA) to see how many true positive spikes remain; (D) perform multi-instrument tests to ensure parameters are not tuned to a single ticker. Document every test and prefer robust, slightly lower returns with clearer logic rather than tuned “optimal” results that fail out of sample.
Originality statement: This script’s originality lies in the curated combination of intraday value (VWAP), multi-EMA trend scoring, momentum percent oscillator, volume Z-score plus buy/sell flow heuristics and a compact, interpretable scoring system. The script is not a simple indicator mashup; it is a didactic ensemble specifically designed to make internal rationale visible so traders can learn how each market characteristic contributes to actionable probability. The tool’s novelty is its emphasis on interpretability — showing the exact contributing signals behind a composite score — enabling reproducible testing and educational value.
Finally, for TradingView publication, include a clear description listing the modules, a short non-technical summary of how they interact, the tunable inputs, limitations and a risk disclaimer. Remove any promotional content or external contact links. If you used trademark symbols, either provide registration details or remove them. This transparent documentation satisfies TradingView’s requirement that mashups justify their composition and teach users how to use them.
Quantum Trading Matrix — multi-factor intraday dashboard (educational use only).
Purpose: Combines intraday VWAP position, a fast/slow EMA momentum percent oscillator, multi-EMA trend scoring (8/21/50), volume Z-score and buy/sell flow heuristics, pivot-based microstructure detection, and ATR-based volatility buckets to produce a transparent, componentized market score and trade-idea indicator. The mashup is intentional: VWAP identifies intraday value, momentum detects short bursts, EMAs provide structural trend bias, and volume/flow confirm participation. Signals require alignment of at least two components (for example, VWAP ABOVE + Momentum BULLISH + positive flow) for higher confidence.
Inputs: momentum period, volume MA/profile length, EMA configuration (8/21/50), trend multiplier, signal sensitivity, color and display options. Use shorter momentum lengths for scalps and longer for swing analysis. Increase volume MA for thinly traded instruments.
Limitations: Institutional/dark-pool estimates and flow heuristics are approximations, not actual exchange tape. VWAP is intraday-focused. Expect false signals during major news or low-liquidity sessions. Backtest and paper-trade before applying real capital.
Risk Disclaimer: For education and analysis only. Not financial advice. Use proper risk management. The author is not responsible for trading losses.
________________________________________
Risk & Misuse Disclaimer
This indicator is provided for education, analysis and idea generation only. It is not investment or financial advice and does not guarantee profits. Institutional activity flags, dark-pool estimates and flow heuristics are approximations and should not be treated as exchange tape. Backtest thoroughly and use demo/paper accounts before trading real capital. Always apply appropriate position sizing and stop-loss rules. The author is not responsible for any trading losses resulting from the use or misuse of this tool.
________________________________________
Risk Disclaimer: This tool is provided for education and analysis only. It is not financial advice and does not guarantee returns. Users assume all risk for trades made based on this script. Back test thoroughly and use proper risk management.

SAP121212 — Close vs VWAP + Optional RSI (Signals)This indicator combines Supertrend, VWAP with bands, and an optional RSI filter to generate Buy/Sell signals.
How it works
Supertrend Flip (ATR-based): Detects when trend direction changes (from bearish to bullish, or bullish to bearish).
VWAP Band Filter: Signals only trigger if the candle close is beyond the VWAP bands:
Buy = Supertrend flips up AND close > VWAP Upper Band
Sell = Supertrend flips down AND close < VWAP Lower Band
Optional RSI Filter:
Buy requires RSI < 20
Sell requires RSI > 80
Can be enabled/disabled in settings.
Features
Choice of VWAP band calculation mode: Standard Deviation or ATR.
Adjustable ATR/StDev length and multiplier for VWAP bands.
Toggle Supertrend, VWAP lines, and Buy/Sell labels.
Alerts included: add alerts on BUY or SELL conditions (use Once Per Bar Close to avoid intrabar signals).
Use
Works best on intraday or higher timeframes where VWAP is relevant.
Use the RSI filter for more selective signals.
Can be combined with your own stop-loss and risk management rules.
⚠️ Disclaimer: This script is for educational and research purposes only. It is not financial advice. Always test thoroughly and trade at your own risk.
SuperTrendSAP1212This indicator combines Supertrend, VWAP with bands, and an optional RSI filter to generate Buy/Sell signals.
How it works
Supertrend Flip (ATR-based): Detects when trend direction changes (from bearish to bullish, or bullish to bearish).
VWAP Band Filter: Signals only trigger if the candle close is beyond the VWAP bands:
Buy = Supertrend flips up AND close > VWAP Upper Band
Sell = Supertrend flips down AND close < VWAP Lower Band
Optional RSI Filter:
Buy requires RSI < 20
Sell requires RSI > 80
Can be enabled/disabled in settings.
Features
Choice of VWAP band calculation mode: Standard Deviation or ATR.
Adjustable ATR/StDev length and multiplier for VWAP bands.
Toggle Supertrend, VWAP lines, and Buy/Sell labels.
Alerts included: add alerts on BUY or SELL conditions (use Once Per Bar Close to avoid intrabar signals).
Use
Works best on intraday or higher timeframes where VWAP is relevant.
Use the RSI filter for more selective signals.
Can be combined with your own stop-loss and risk management rules.
⚠️ Disclaimer: This script is for educational and research purposes only. It is not financial advice. Always test thoroughly and trade at your own risk.

[blackcat] L2 Trend LinearityOVERVIEW
The L2 Trend Linearity indicator is a sophisticated market analysis tool designed to help traders identify and visualize market trend linearity by analyzing price action relative to dynamic support and resistance zones. This powerful Pine Script indicator utilizes the Arnaud Legoux Moving Average (ALMA) algorithm to calculate weighted price calculations and generate dynamic support/resistance zones that adapt to changing market conditions. By visualizing market zones through colored candles and histograms, the indicator provides clear visual cues about market momentum and potential trading opportunities. The script generates buy/sell signals based on zone crossovers, making it an invaluable tool for both technical analysis and automated trading strategies. Whether you're a day trader, swing trader, or algorithmic trader, this indicator can help you identify market regimes, support/resistance levels, and potential entry/exit points with greater precision.
FEATURES
Dynamic Support/Resistance Zones: Calculates dynamic support (bear market zone) and resistance (bull market zone) using weighted price calculations and ALMA smoothing
Visual Market Representation: Color-coded candles and histograms provide immediate visual feedback about market conditions
Smart Signal Generation: Automatic buy/sell signals generated from zone crossovers with clear visual indicators
Customizable Parameters: Four different ALMA smoothing parameters for various timeframes and trading styles
Multi-Timeframe Compatibility: Works across different timeframes from 1-minute to weekly charts
Real-time Analysis: Provides instant feedback on market momentum and trend direction
Clear Visual Cues: Green candles indicate bullish momentum, red candles indicate bearish momentum, and white candles indicate neutral conditions
Histogram Visualization: Blue histogram shows bear market zone (below support), aqua histogram shows bull market zone (above resistance)
Signal Labels: "B" labels mark buy signals (price crosses above resistance), "S" labels mark sell signals (price crosses below support)
Overlay Functionality: Works as an overlay indicator without cluttering the chart with unnecessary elements
Highly Customizable: All parameters can be adjusted to suit different trading strategies and market conditions
HOW TO USE
Add the Indicator to Your Chart
Open TradingView and navigate to your desired trading instrument
Click on "Indicators" in the top menu and select "New"
Search for "L2 Trend Linearity" or paste the Pine Script code
Click "Add to Chart" to apply the indicator
Configure the Parameters
ALMA Length Short: Set the short-term smoothing parameter (default: 3). Lower values provide more responsive signals but may generate more false signals
ALMA Length Medium: Set the medium-term smoothing parameter (default: 5). This provides a balance between responsiveness and stability
ALMA Length Long: Set the long-term smoothing parameter (default: 13). Higher values provide more stable signals but with less responsiveness
ALMA Length Very Long: Set the very long-term smoothing parameter (default: 21). This provides the most stable support/resistance levels
Understand the Visual Elements
Green Candles: Indicate bullish momentum when price is above the bear market zone (support)
Red Candles: Indicate bearish momentum when price is below the bull market zone (resistance)
White Candles: Indicate neutral market conditions when price is between support and resistance zones
Blue Histogram: Shows bear market zone when price is below support level
Aqua Histogram: Shows bull market zone when price is above resistance level
"B" Labels: Mark buy signals when price crosses above resistance
"S" Labels: Mark sell signals when price crosses below support
Identify Market Regimes
Bullish Regime: Price consistently above resistance zone with green candles and aqua histogram
Bearish Regime: Price consistently below support zone with red candles and blue histogram
Neutral Regime: Price oscillating between support and resistance zones with white candles
Generate Trading Signals
Buy Signals: Look for price crossing above the bull market zone (resistance) with confirmation from green candles
Sell Signals: Look for price crossing below the bear market zone (support) with confirmation from red candles
Confirmation: Always wait for confirmation from candle color changes before entering trades
Optimize for Different Timeframes
Scalping: Use shorter ALMA lengths (3-5) for 1-5 minute charts
Day Trading: Use medium ALMA lengths (5-13) for 15-60 minute charts
Swing Trading: Use longer ALMA lengths (13-21) for 1-4 hour charts
Position Trading: Use very long ALMA lengths (21+) for daily and weekly charts
LIMITATIONS
Whipsaw Markets: The indicator may generate false signals in choppy, sideways markets where price oscillates rapidly between support and resistance
Lagging Nature: Like all moving average-based indicators, there is inherent lag in the calculations, which may result in delayed signals
Not a Standalone Tool: This indicator should be used in conjunction with other technical analysis tools and risk management strategies
Market Structure Dependency: Performance may vary depending on market structure and volatility conditions
Parameter Sensitivity: Different markets may require different parameter settings for optimal performance
No Volume Integration: The indicator does not incorporate volume data, which could provide additional confirmation signals
Limited Backtesting: Pine Script limitations may restrict comprehensive backtesting capabilities
Not Suitable for All Instruments: May perform differently on stocks, forex, crypto, and futures markets
Requires Confirmation: Signals should always be confirmed with other indicators or price action analysis
Not Predictive: The indicator identifies current market conditions but does not predict future price movements
NOTES
ALMA Algorithm: The indicator uses the Arnaud Legoux Moving Average (ALMA) algorithm, which is known for its excellent smoothing capabilities and reduced lag compared to traditional moving averages
Weighted Price Calculations: The bear market zone uses (2low + close) / 3, while the bull market zone uses (high + 2close) / 3, providing more weight to recent price action
Dynamic Zones: The support and resistance zones are dynamic and adapt to changing market conditions, making them more responsive than static levels
Color Psychology: The color scheme follows traditional trading psychology - green for bullish, red for bearish, and white for neutral
Signal Timing: The signals are generated on the close of each bar, ensuring they are based on complete price action
Label Positioning: Buy signals appear below the bar (red "B" label), while sell signals appear above the bar (green "S" label)
Multiple Timeframes: The indicator can be applied to multiple timeframes simultaneously for comprehensive analysis
Risk Management: Always use proper risk management techniques when trading based on indicator signals
Market Context: Consider the overall market context and trend direction when interpreting signals
Confirmation: Look for confirmation from other indicators or price action patterns before entering trades
Practice: Test the indicator on historical data before using it in live trading
Customization: Feel free to experiment with different parameter combinations to find what works best for your trading style
THANKS
Special thanks to the TradingView community and the Pine Script developers for creating such a powerful and flexible platform for technical analysis. This indicator builds upon the foundation of the ALMA algorithm and various moving average techniques developed by technical analysis pioneers. The concept of dynamic support and resistance zones has been refined over decades of market analysis, and this script represents a modern implementation of these timeless principles. We acknowledge the contributions of all traders and developers who have contributed to the evolution of technical analysis and continue to push the boundaries of what's possible with algorithmic trading tools.

Candle Spread + ATR SMA Analysis
This indicator combines elements from two popular open-source scripts — Candle Range Compare
by @oldinvestor
and Objective Analysis of Spread (VSA)
by @Rin-Nin
— into a single tool for analyzing candle spreads (ranges and bodies) in relation to volatility benchmarks.
🔎 What It Does
Candle Decomposition:
Plots total candle ranges (high–low) in gray, for both up and down closes.
Plots up-close bodies (open–close) in white.
Plots down-close bodies in black.
This makes it easy to spot whether volatility comes from real price movement (body) or extended wicks.
ATR & SMA Volatility Bands:
Calculates ATR (Average True Range) and overlays it as a black line.
Plots four volatility envelopes derived from the SMA of the true range:
0.8× (blue, shaded)
1.3× (green)
1.8× (red)
3.0× (purple)
Colored fill zones highlight when candle spreads are below, within, or above key thresholds.
Visual Context:
Track expansion/contraction in spreads.
Compare bullish (white) vs bearish (black) bodies to gauge buying/selling pressure.
Identify when candles stretch beyond typical volatility ranges.
📈 How To Use It
VSA context: Wide down bars (black) beyond ATR bands may suggest supply; wide up bars (white) may indicate demand.
Trend confirmation: Expanding ranges above average thresholds (green/red/purple bands) often confirm momentum.
Reversal potential: Small bodies but large ranges (gray + wicks) frequently appear at turning points.
Volatility filter: Use ATR bands to filter trades — e.g., only act when candle ranges exceed 1.3× or 1.8× SMA thresholds.
🙏 Credits
This script is inspired by and combines ideas from:
Candle Range Compare
by @oldinvestor
Objective Analysis of Spread (VSA)
by @Rin-Nin
Big thanks to both authors for their valuable contributions to the TradingView community.
One thing I couldnt quite get to work is being able to display up and down wicks like in the candle range compare, so I just add that indicator to the chart as well, uncheck everything but the wick plots and there it is.

Cyclic Reversal Engine [AlgoPoint]Overview
Most indicators focus on price and momentum, but they often ignore a critical third dimension: time. Markets move in rhythmic cycles of expansion and contraction, but these cycles are not fixed; they speed up in trending markets and slow down in choppy conditions.
The Cyclic Reversal Engine is an advanced analytical tool designed to decode this rhythm. Instead of relying on static, lagging formulas, this indicator learns from past market behavior to anticipate when the current trend is statistically likely to reach its exhaustion point, providing high-probability reversal signals.
It achieves this by combining a sophisticated time analysis with a robust price-action confirmation.
How It Works: The Core Logic
The indicator operates on a multi-stage process to identify potential turning points in the market.
1. Market Regime Analysis (The Brain): Before analyzing any cycles, the indicator first diagnoses the current "personality" of the market. Using a combination of the ADX, Choppiness Index, and RSI, it classifies the market into one of three primary regimes:
- Trending: Strong, directional movement.
- Ranging: Sideways, non-directional chop.
- Reversal: An over-extended state (overbought/oversold) where a turn is imminent.
2. Adaptive Cycle Learning (The "Machine Learning" Aspect): This is the indicator's smartest feature. It constantly analyzes past cycles by measuring the bar-count between significant swing highs and swing lows. Crucially, it learns the average cycle duration for each specific market regime. For example, it learns that "in a strong trending market, a new swing low tends to occur every 35 bars," while "in a ranging market, this extends to 60 bars."
3. The Countdown & Timing Signal: The indicator identifies the last major swing high or low and starts a bar-by-bar countdown. Based on the current market regime, it selects the appropriate learned cycle length from its memory. When the bar count approaches this adaptive target, the indicator determines that a reversal is "due" from a timing perspective.
4. Price Confirmation (The Trigger): A signal is never generated based on timing alone. Once the timing condition is met (the cycle is "due"), the indicator waits for a final price-action confirmation. The default confirmation is the RSI entering an extreme overbought or oversold zone, signaling momentum exhaustion. The signal is only triggered when Time + Price Confirmation align.
How to Use This Indicator
- The Dashboard: The panel in the bottom-right corner is your command center.
- Market Regime: Shows the current market personality analyzed by the engine.
- Adaptive Cycle / Bar Count: This is the core of the indicator. It shows the target cycle length for the current regime (e.g., 50) and the current bar count since the last swing point (e.g., 45). The background turns orange when the bar count enters the "due zone," indicating that you should be on high alert for a reversal.
- BUY/SELL Signals: A label appears on the chart only when the two primary conditions are met:
The timing is right (Bar Count has reached the Adaptive Cycle target).
The price confirms exhaustion (RSI is in an extreme zone).
A BUY signal suggests a downtrend cycle is likely complete, and a SELL signal suggests an uptrend cycle is likely complete.
Key Settings
- Pivot Lookback: Controls the sensitivity of the swing point detection. Higher values will identify more significant, longer-term cycles.
- Market Regime Engine: The ADX, Choppiness, and RSI settings can be fine-tuned to adjust how the indicator classifies the market's personality.
- Require Price Confirmation: You can toggle the RSI confirmation on or off. It is highly recommended to keep it enabled for higher-quality signals.

Marubozu Detector with Dynamic SL/TP
Strategy Overview:
This indicator detects a "Marubozu" bullish pattern or a “Marubozu” bearish pattern to suggest potential buy and sell opportunities. It uses dynamic Stop Loss (SL) and Take Profit (TP) management, based on either market volatility (ATR) or liquidity zones.
This tool is intended for educational and informational purposes only.
Key Features:
Entry: Based on detecting Marubozu bullish or bearish candle pattern.
Exit: Targets are managed through ATR multiples or previous liquidity levels (swing highs or swing lows).
Smart Liquidity: Optionally identify deeper liquidity targets.
Full Alerts: Buy and Sell signals supported with customizable alerts.
Visualized Trades: Entry, SL, and TP levels are plotted on the chart.
User Inputs:
ATR Length, ATR Multipliers
Take Profit Mode (Liquidity/ATR)
Swing Lookback and Strength
Toggleable Buy/Sell alerts
All Time Frames
📖 How to Use:
Add the Indicator:
Apply the script to your chart from the TradingView indicators panel.
Look for Buy Signals:
A buy signal is triggered when the script detects a "Marubozu" bullish pattern.
Entry, Stop Loss, and Take Profit levels are plotted automatically.
Look for Sell Signals:
A Sell signal is triggered when the script detects a "Marubozu" bearish pattern.
Entry, Stop Loss, and Take Profit levels are plotted automatically.
Choose Take Profit Mode:
ATR Mode: TP is based on a volatility target.
Liquidity Mode: TP is based on past swing highs.
Set Alerts (Optional):
Enable Buy/Sell alerts in the settings to receive real-time notifications.
Practice First:
Always backtest and paper trade before live use.
📜 Disclaimer:
This script does not offer financial advice.
No guarantees of profit or performance are made.
Use in demo accounts or backtesting first.
Always practice proper risk management and seek advice from licensed professionals if needed.
✅ Script Compliance:
This script is designed in full accordance with TradingView’s House Rules for educational tools.
No financial advice is provided, no performance is guaranteed, and users are encouraged to backtest thoroughly.

Hilly's Advanced Crypto Scalping Strategy - 5 Min ChartTo determine the "best" input parameters for the Advanced Crypto Scalping Strategy on a 5-minute chart, we need to consider the goals of optimizing for profitability, minimizing false signals, and adapting to the volatile nature of cryptocurrencies. The default parameters in the script are a starting point, but the optimal values depend on the specific cryptocurrency pair, market conditions, and your risk tolerance. Below, I'll provide recommended input values based on common practices in crypto scalping, along with reasoning for each parameter. I’ll also suggest how to fine-tune them using TradingView’s backtesting and optimization tools.
Recommended Input Parameters
These values are tailored for a 5-minute chart for liquid cryptocurrencies like BTC/USD or ETH/USD on exchanges like Binance or Coinbase. They aim to balance signal frequency and accuracy for day trading.
Fast EMA Length (emaFastLen): 9
Reasoning: A 9-period EMA is commonly used in scalping to capture short-term price movements while remaining sensitive to recent price action. It reacts faster than the default 10, aligning with the 5-minute timeframe.
Slow EMA Length (emaSlowLen): 21
Reasoning: A 21-period EMA provides a good balance for identifying the broader trend on a 5-minute chart. It’s slightly longer than the default 20 to reduce noise while confirming the trend direction.
RSI Length (rsiLen): 14
Reasoning: The default 14-period RSI is a standard choice for momentum analysis. It works well for detecting overbought/oversold conditions without being too sensitive on short timeframes.
RSI Overbought (rsiOverbought): 75
Reasoning: Raising the overbought threshold to 75 (from 70) reduces false sell signals in strong bullish trends, which are common in crypto markets.
RSI Oversold (rsiOversold): 25
Reasoning: Lowering the oversold threshold to 25 (from 30) filters out weaker buy signals, ensuring entries occur during stronger reversals.
MACD Fast Length (macdFast): 12
Reasoning: The default 12-period fast EMA for MACD is effective for capturing short-term momentum shifts in crypto, aligning with scalping goals.
MACD Slow Length (macdSlow): 26
Reasoning: The default 26-period slow EMA is a standard setting that works well for confirming momentum trends without lagging too much.
MACD Signal Smoothing (macdSignal): 9
Reasoning: The default 9-period signal line is widely used and provides a good balance for smoothing MACD crossovers on a 5-minute chart.
Bollinger Bands Length (bbLen): 20
Reasoning: The default 20-period Bollinger Bands are effective for identifying volatility breakouts, which are key for scalping in crypto markets.
Bollinger Bands Multiplier (bbMult): 2.0
Reasoning: A 2.0 multiplier is standard and captures most price action within the bands. Increasing it to 2.5 could reduce signals but improve accuracy in highly volatile markets.
Stop Loss % (slPerc): 0.8%
Reasoning: A tighter stop loss of 0.8% (from 1.0%) suits the high volatility of crypto, helping to limit losses on false breakouts while keeping risk manageable.
Take Profit % (tpPerc): 1.5%
Reasoning: A 1.5% take-profit target (from 2.0%) aligns with scalping’s goal of capturing small, frequent gains. Crypto markets often see quick reversals, so a smaller target increases the likelihood of hitting profits.
Use Candlestick Patterns (useCandlePatterns): True
Reasoning: Enabling candlestick patterns (e.g., engulfing, hammer) adds confirmation to signals, reducing false entries in choppy markets.
Use Volume Filter (useVolumeFilter): True
Reasoning: The volume filter ensures signals occur during high-volume breakouts, which are more likely to sustain in crypto markets.
Signal Arrow Size (signalSize): 2.0
Reasoning: Increasing the arrow size to 2.0 (from 1.5) makes buy/sell signals more visible on the chart, especially on smaller screens or volatile price action.
Background Highlight Transparency (bgTransparency): 85
Reasoning: A slightly higher transparency (85 from 80) keeps the background highlights subtle but visible, avoiding chart clutter.
How to Apply These Parameters
Copy the Script: Use the Pine Script provided in the previous response.
Paste in TradingView: Open TradingView, go to the Pine Editor, paste the code, and click "Add to Chart."
Set Parameters: In the strategy settings, manually input the recommended values above or adjust them via the input fields.
Test on a 5-Minute Chart: Apply the strategy to a liquid crypto pair (e.g., BTC/USDT, ETH/USDT) on a 5-minute chart.
Fine-Tuning for Optimal Performance
To find the absolute best parameters for your specific trading pair and market conditions, use TradingView’s Strategy Tester and optimization features:
Backtesting:
Run the strategy on historical data for your chosen pair (e.g., BTC/USDT on Binance).
Check metrics like Net Profit, Profit Factor, Win Rate, and Max Drawdown in the Strategy Tester.
Focus on a sample period of at least 1–3 months to capture various market conditions (bull, bear, sideways).
Parameter Optimization:
In the Strategy Tester, click the settings gear next to the strategy name.
Enable optimization for key inputs like emaFastLen (test range: 7–12), emaSlowLen (15–25), slPerc (0.5–1.5), and tpPerc (1.0–3.0).
Run the optimization to find the combination with the highest net profit or best Sharpe ratio, but avoid over-optimization (curve-fitting) by testing on out-of-sample data.
Market-Specific Adjustments:
Volatile Pairs (e.g., DOGE/USDT): Use tighter stop losses (e.g., 0.5–0.7%) and smaller take-profit targets (e.g., 1.0–1.2%) to account for rapid price swings.
Stable Pairs (e.g., BTC/USDT): Slightly wider stop losses (e.g., 1.0–1.2%) and take-profit targets (e.g., 1.8–2.5%) may work better.
Trending Markets: Increase emaSlowLen (e.g., to 25–30) to follow stronger trends.
Choppy Markets: Tighten bbMult (e.g., to 1.8) and lower rsiOverbought/rsiOversold (e.g., to 70/30) to filter noise.
Forward Testing:
After backtesting, run the strategy in real-time on a demo account for 1–2 weeks to validate performance under current market conditions.
Important Notes
No Universal "Best" Numbers: Optimal parameters vary by crypto pair, exchange, and market conditions (e.g., bull vs. bear market). The suggested values are a starting point based on common scalping practices.
Risk Management: Never risk more than 1–2% of your account per trade. Adjust position sizing in TradingView’s strategy settings to align with your risk tolerance.
Market Volatility: Crypto markets are highly volatile. Test the strategy on your specific pair and adjust parameters if signals are too frequent or too rare.
Not Financial Advice: This is an educational tool. Backtest thoroughly and use a demo account before trading with real funds.
If you want me to generate a chart showing backtest performance for specific parameters or to tweak the script further (e.g., adding more indicators or adjusting signal logic), let me know!can you add clear buy ans sell signs above the candles in this codeTo add clear buy and sell signals above the candles in the provided Pine Script, I'll modify the existing code to include prominent text labels directly above (for sell signals) and below (for buy signals) the candles. These labels will be larger, color-coded, and positioned to avoid clutter, ensuring they are easily visible on the chart. The core strategy logic (EMA, RSI, MACD, Bollinger Bands, candlestick patterns, and volume filter) will remain unchanged, and I'll reuse the same artifact_id since this is an update to the previous script.AdvancedCryptoScalpingStrategy.pinex-pine

ICT FVG Buy/Sell SignalsThis bot is built on ICT (Inner Circle Trader) concepts such as:
Fair Value Gaps (FVGs) – imbalance zones between candles.
Consequent Encroachment (CE) – the midpoint of a gap.
Premium / Discount Arrays – dealing ranges split into premium (sell-side) and discount (buy-side) zones.
Displacement candles – strong impulsive moves that confirm intent.
The bot scans for FVGs, marks CE levels, and waits for price to return to these levels.
When price revisits a valid FVG zone with displacement confirmation and in the correct PD array, the bot generates a BUY or SELL signal.
✅ Signal Rules
Buy Signal
Price trades back into a Bullish FVG.
Current bar shows bullish displacement (large bullish body relative to ATR).
Price is in discount territory of the current dealing range (if PD filter is enabled).
Close is above the CE line of the FVG.
Sell Signal
Price trades back into a Bearish FVG.
Current bar shows bearish displacement.
Price is in premium territory of the current dealing range.
Close is below the CE line of the FVG.
🎯 What You’ll See on the Chart
Green “BUY” labels below candles when long signals trigger.
Red “SELL” labels above candles when short signals trigger.
Shaded background:
Red = Premium zone (sell side).
Teal = Discount zone (buy side).
Yellow line = dealing range midpoint (equilibrium).
Dots on CE lines = midpoints of the latest bullish/bearish FVG.
🔔 Alerts
ICT Buy → Triggers when a bullish setup confirms.
ICT Sell → Triggers when a bearish setup confirms.
You can connect these alerts to:
TradingView notifications.
Webhooks (for brokers or bots like MetaTrader, NinjaTrader, or Discord).
⚙️ Settings
Swing length – how many bars to use when detecting swing highs/lows for the dealing range.
Use PD filter – toggle ON/OFF for requiring discount/premium alignment.
Displacement ATR multiple – how strong the candle body must be compared to ATR to count as a displacement.
ATR length – used for displacement filter.
📈 Supported Markets
Works on all symbols and timeframes.
Commonly applied to:
NASDAQ (NQ, QQQ)
S&P500 (ES, SPX, SPY)
Forex pairs
Crypto (BTC, ETH, etc.)
⚠️ Disclaimer
This bot is for educational purposes only. It does not guarantee profits and should be tested on demo accounts first.
Always apply proper risk management before trading live.

EMA20 Cross Strategy with countertrades and signalsEMA20 Cross Strategy Documentation
Overview
The EMA20 Cross Strategy with Counter-Trades and Instant Signals is a Pine Script (version 6) trading strategy designed for the TradingView platform. It implements an Exponential Moving Average (EMA) crossover system to generate buy and sell signals, with optional trend filtering, session-based trading, instant signal processing, and visual/statistical feedback. The strategy supports counter-trades (closing opposing positions before entering new ones) and operates with a fixed trade size in EUR.
Features
EMA Crossover Mechanism:
Uses a short-term EMA (configurable length, default: 1) and a long-term EMA (default: 20) to detect crossovers.
A buy signal is generated when the short EMA crosses above the long EMA.
A sell signal is generated when the short EMA crosses below the long EMA.
Instant Signals:
If enabled (useInstantSignals), signals are based on the current price crossing the short EMA, rather than waiting for the candle close.
This allows faster trade execution but may increase sensitivity to price fluctuations.
Trend Filter:
Optionally filters trades based on the trend direction (useTrendFilter).
Long trades are allowed only when the short EMA (or price, for instant signals) is above the long EMA.
Short trades are allowed only when the short EMA (or price) is below the long EMA.
Session Filter:
Restricts trading to specific market hours (sessionStart, default: 09:00–17:00) if enabled (useSessionFilter).
Ensures trades occur only during active market sessions, reducing exposure to low-liquidity periods.
Customizable Timeframe:
The EMA calculations can use a higher timeframe (e.g., 5m, 15m, 1H, 4H, 1D, default: 1H) via request.security.
This allows the strategy to base signals on longer-term trends while operating on a shorter-term chart.
Trade Management:
Fixed trade size of €100,000 per trade (tradeAmount), with a maximum quantity cap (maxQty = 10,000) to prevent oversized trades.
Counter-trades: Closes short positions before entering a long position and vice versa.
Trades are executed with a minimum quantity of 1 to ensure valid orders.
Visualization:
EMA Lines: The short EMA is colored based on the last signal (green for buy, red for sell, gray for neutral), and the long EMA is orange.
Signal Markers: Displays buy/sell signals as arrows (triangles) above/below candles if enabled (showSignalShapes).
Background/Candle Coloring: Optionally colors the chart background or candles green (bullish) or red (bearish) based on the trend (useColoredBars).
Statistics Display:
If enabled (useStats), a label on the chart shows:
Total closed trades
Open trades
Win rate (%)
Number of winning/losing trades
Profit factor (gross profit / gross loss)
Net profit
Maximum drawdown
Configuration Inputs
EMA Short Length (emaLength): Length of the short-term EMA (default: 1).
Trend EMA Length (trendLength): Length of the long-term EMA (default: 20).
Enable Trend Filter (useTrendFilter): Toggles trend-based filtering (default: true).
Color Candles (useColoredBars): Colors candles instead of the background (default: true).
Enable Session Filter (useSessionFilter): Restricts trading to specified hours (default: false).
Trading Session (sessionStart): Defines trading hours (default: 09:00–17:00).
Show Statistics (useStats): Displays performance stats on the chart (default: true).
Show Signal Arrows (showSignalShapes): Displays buy/sell signals as arrows (default: true).
Use Instant Signals (useInstantSignals): Generates signals based on live price action (default: false).
EMA Timeframe (emaTimeframe): Timeframe for EMA calculations (options: 5m, 15m, 1H, 4H, 1D; default: 1H).
Strategy Logic
Signal Generation:
Standard Mode: Signals are based on EMA crossovers (short EMA crossing long EMA) at candle close.
Instant Mode: Signals are based on the current price crossing the short EMA, enabling faster reactions.
Trade Execution:
On a buy signal, closes any short position and opens a long position.
On a sell signal, closes any long position and opens a short position.
Position size is calculated as the minimum of €100,000 or available equity, divided by the current price, capped at 10,000 units.
Filters:
Trend Filter: Ensures trades align with the trend direction (if enabled).
Session Filter: Restricts trades to user-defined market hours (if enabled).
Visual Feedback
EMA Lines: Provide a clear view of the short and long EMAs, with the short EMA’s color reflecting the latest signal.
Signal Arrows: Large green triangles (buy) below candles or red triangles (sell) above candles for easy signal identification.
Chart Coloring: Highlights bullish (green) or bearish (red) trends via background or candle colors.
Statistics Label: Displays key performance metrics in a label above the chart for quick reference.
Usage Notes
Initial Capital: €100,000 (configurable via initial_capital).
Currency: EUR (set via currency).
Order Processing: Orders are processed at candle close (process_orders_on_close=true) unless instant signals are enabled.
Dynamic Requests: Allows dynamic timeframe adjustments for EMA calculations (dynamic_requests=true).
Platform: Designed for TradingView, compatible with any market supported by the platform (e.g., stocks, forex, crypto).
Example Use Case
Scenario: Trading on a 5-minute chart with a 1-hour EMA timeframe, trend filter enabled, and session filter set to 09:00–17:00.
Behavior: The strategy will:
Calculate EMAs on the 1-hour timeframe.
Generate buy signals when the short EMA crosses above the long EMA (and price is above the long EMA).
Generate sell signals when the short EMA crosses below the long EMA (and price is below the long EMA).
Execute trades only during 09:00–17:00.
Display green/red candles and performance stats on the chart.
Limitations
Instant Signals: May lead to more frequent signals, increasing the risk of false positives in volatile markets.
Fixed Trade Size: Does not adjust dynamically based on market conditions beyond equity and max quantity limits.
Session Filter: Simplified and may not account for complex session rules or holidays.
Statistics: Displayed on-chart, which may clutter the view in smaller charts.
Customization
Adjust emaLength and trendLength to suit different market conditions (e.g., shorter for scalping, longer for swing trading).
Toggle useInstantSignals for faster or more stable signal generation.
Modify sessionStart to align with specific market hours.
Disable useStats or showSignalShapes for a cleaner chart.
This strategy is versatile for both manual and automated trading, offering flexibility for various markets and trading styles while providing clear visual and statistical feedback.

MACD Positive & Negative AlertThe MACD (Moving Average Convergence Divergence) is a momentum and trend-following indicator that helps traders identify the strength and direction of a trend, spot potential reversals, and fine-tune entry/exit timing.
Core Components
- MACD Line:
The difference between the 12-period and 26-period EMA (Exponential Moving Averages). This line highlights shifts in momentum and identifies the prevailing trend direction.
- Signal Line:
A 9-period EMA of the MACD line, acting as a trigger for buy/sell signals. When the MACD line crosses above the signal line, it suggests a bullish signal; when it crosses below, it suggests a bearish one.
- Histogram:
Shows the difference between the MACD line and the signal line as a bar graph. The histogram helps traders gauge the strength of the momentum and can warn of possible reversals. A rapidly growing histogram means strengthening momentum, while a shrinking one indicates weakening momentum.
Main Uses
- Trend Identification:
A positive MACD value typically signals a bullish trend, while a negative value signals a bearish trend.
- Momentum Analysis:
Divergences between MACD and price can warn of upcoming reversals. Increasing MACD histogram bars confirm strong momentum; shrinking bars suggest consolidation or reversal.
- Signal Generation:
Crossovers between the MACD line and the signal line generate trade signals—bullish (buy) if the MACD moves above the signal, bearish (sell) if it falls below l.
Example Interpretation
- MACD Crossover:
If the MACD line crosses above the signal line, it's often considered a buy signal; a cross below is a sell signal.
- Zero Line Cross:
If the MACD histogram moves from below zero to above, this is considered a bullish momentum shift; above zero to below is a bearish move.
The MACD is most effective in trending markets and should ideally be used alongside additional indicators for robust trading decisions.

Triple Tap Sniper Triple Tap Sniper v3 – EMA Retest Precision System
Triple Tap Sniper is a precision trading tool built around the 21, 34, and 55 EMAs, designed to capture high-probability retests after EMA crosses. Instead of chasing the first breakout candle, the system waits for the first pullback into the EMA21 after a trend-confirming cross — the spot where professional traders often enter.
🔑 Core Logic
EMA Alignment → Trend defined by EMA21 > EMA34 > EMA55 (bullish) or EMA21 < EMA34 < EMA55 (bearish).
Cross Detection → Signals are only armed after a fresh EMA cross.
Retest Entry → Buy/Sell signals fire only on the first retest of EMA21, with trend still intact.
Pro Filters →
📊 Higher Timeframe Confirmation: Aligns signals with larger trend.
📈 ATR Volatility Filter: Blocks weak signals in low-vol chop.
📏 EMA Spread Filter: Ignores tiny “fake crosses.”
🕯️ Price Action Filter: Requires a proper wick rejection for valid entries.
🚀 Why Use Triple Tap Sniper?
✅ Filters out most false signals from sideways markets.
✅ Focuses only on clean trend continuations after pullbacks.
✅ Beginner-friendly visuals (Buy/Sell labels) + alert-ready for automation.
✅ Flexible: works across multiple timeframes & asset classes (stocks, crypto, forex).
⚠️ Notes
This is a signal indicator, not a full strategy. For backtesting and optimization, convert to a strategy and adjust filters per market/timeframe.
No indicator guarantees profits — use with sound risk management.

Elliott Wave Rule EngineWhat this tool does
The indicator scans price for two concurrent swing structures—a Small (shorter-degree) and a Large (higher-degree) set—then applies an Elliott/NeoWave rule engine to the most recent 5-swing motive (1-2-3-4-5) or 3-swing corrective (A-B-C). It produces:
Blue lines for Small swings and Orange lines for Large swings.
A rule dashboard (optional) showing PASS/FAIL/WARN for core rules & guidelines.
Buy/Sell labels when (a) a valid motive completes and (b) loop “consensus,” alignment, and scoring gates are satisfied.
Reading the chart
Small swings: thin blue segments, built from your Small settings.
Large swings: thicker orange segments, from your Large settings.
Background tint: faint green when a motive (impulse/diagonal) is valid right now on Small.
Labels (if enabled):
“1…5” or “A-B-C” markers on the latest detected structure.
Buy/Sell label at the last pivot when all gates pass; text may include a score %.
How it works
For both Small and Large degrees the script:
- Loops over all (left, right) combinations you specify (e.g., Small Left = 3..6, Right = 0..0) and calls ta.pivothigh/low.
- Aggregates the results:
- Keeps the most extreme pivot found in the loop (highest high or lowest low) that’s newer than the last accepted swing.
- Gates acceptance by minimum % change versus the last opposite swing (inside the loop) and a post-aggregation filter (Small Minimum swing %, Large Minimum swing %).
- Merges back-to-back same-type swings (HH or LL) by keeping only the more extreme one.
- Keeps only the last N=lookbackWaves swings (default 100).
- Consensus (used for signals) comes from the loop counts:
- sBuyConsensus = small L-count / total-combos (bullish bias)
- sSellConsensus = small H-count / total-combos (bearish bias)
(and the same for Large). This is a data-driven “how many combos agreed” measure.
2) Rule engine (Impulse/Diagonal vs. Corrective)
When there are at least 6 Small swings, the engine tests 1-2-3-4-5:
Hard rules (must pass for an Impulse):
- Wave-2 not > 100% of Wave-1 (no retrace beyond start of W1).
- Wave-3 not the shortest among 1,3,5.
- Wave-4 doesn’t overlap Wave-1 (if it does, structure may be a Diagonal).
- Diagonal eligibility: Rules 1 & 2 pass but Rule 3 fails ⇒ eligible as a Diagonal (
Guidelines (7 checks, count toward a threshold you set):
- W2 retraces a Fib level (within ±fibTol).
- W4 retraces a Fib level (within ±fibTol).
- W3 strongest momentum (speed = |Δprice| / bars).
- Alternation: W2 vs W4 have meaningfully different “sharpness” (price per bar), threshold altSlopeThr.
- Proportion (Price): |W1| and |W3| within propTolP× each other.
- Proportion (Time): W1W3 and W2W4 durations within propTolT×.
- W5 weaker than W3 (momentum divergence proxy).
A Motive is valid if:
- Impulse: all 3 hard rules pass and guideline passes ≥ Min guideline passes.
- Diagonal: diagonal-eligible and guideline passes ≥ Min guideline passes.
- if motive fails, the engine still evaluates ABC as Zigzag and Flat to populate the table:
- Zigzag: B shallower than ~0.618A; C ≈ A or 1.618A (±fibTol).
- Flat: B ≥ ~0.9A; expanded flat if B > 1.0A and C in *A; “running” note if C < A.
3) Signal logic (consensus-gated & scored)
Signals fire only on new Small pivots and only if a Small motive just validated:Direction comes from the motive’s W1 (up = bull, down = bear).
Consensus checks (from the loop):
Use Sell consensus if the last pivot is a High, or Buy consensus if it’s a Low.Require it ≥ Min SMALL loop consensus and ahead of the opposite side by at least Min consensus margin.If you also require Large quality: check the corresponding Large consensus ≥ Min LARGE loop consensus.
Alignment: If Require small/large directional alignment is ON, Small and Large directions must match (or the Large motive must be complete).
Score:
- If Large not required: finalScore = smallConsensus × smallQuality.
- If Large required: finalScore = smallConsensus × smallQuality × largeQuality.
- Need finalScore ≥ Min final score.
When all gates pass, you’ll see “Buy xx%” or “Sell xx%” at the pivot.
Inputs (explained):
- Smaller Wave Swing Detection (Looped)
- Small Left Min / Max (default 3..6): ta.pivot* left widths to scan.
- Small Right Min / Max (default 0..0): right widths to scan (0 = earliest confirmation).
- Small Minimum swing % (post-aggregation) (0.3%): filters out tiny swings after the loop.
- Larger Wave Swing Detection (Looped)
- Large Left Min / Max (100..200) and Right Min/Max (0..0): higher-degree scan (defaults are big; adjust for intraday).
- Large Minimum swing % (post-aggregation) (1.5%).
- Loop Filters (inside the loop)
- Small loop min % change (0.20%): a candidate pivot counts only if move vs. last opposite Small swing ≥ this.
- Large loop min % change (1.50%): same idea for Large.
Rule Engine Tolerances
- Fibonacci tolerance (±%) (0.05 = 5%): closeness to Fib levels.
-Same-degree TIME proportion max (x) (2.00×) and PRICE proportion max (x) (3.00×).
- Alternation slope ratio threshold (0.10): higher = stricter alternation.
- Min guideline passes (0–7) (5): threshold for motive validity.
- Signal Probability (Loop Consensus)
- Min SMALL loop consensus (0.60).
- Min LARGE loop consensus (0.50) (used only if Large validation matters).
- Min consensus margin vs opposite (0.10): e.g., 0.60 vs 0.45 fails (margin 0.15 passes).
Require LARGE 1–5 valid (or diagonal) for signal (off by default).
Min final score (0.20): gate on the composite score.
Annotate label with score % (on).
WARN (orange): guideline not met—pattern can still be valid if total passes ≥ Min guideline passes.
FAQ
Q: Why did I get a diagonal instead of an impulse?
A: Wave-4 overlapped Wave-1 (Rule 3). If Rules 1 & 2 pass and guidelines meet your minimum, it’s eligible as a Diagonal.
Q: Where do Buy/Sell labels come from?
A: Only after a valid Small motive at a new pivot, and only if consensus, alignment, and final score gates pass (per your settings).
Q: It “missed” a wave in hindsight.
A: Pivots require right bars to confirm; extremely tight settings can filter that swing; adjust Small min % or ranges.
Q: Are there repaints?
A: No, It uses standard pivot confirmation; until a pivot is confirmed, recent swings can evolve. After confirmation, lines/labels are stable.
Limitations & disclaimers
Elliott/NeoWave rules are heuristics; markets are messy. Treat outputs as structured context, not certainty.
Consensus is pattern-scan agreement, not probability of profit Not investment advice; always couple with risk management.

X-Scalp by LogicatX-Scalp by Logicat — Clean-Range MTF Scalper
Turn noisy intraday action into clear, actionable scalps. X-Scalp builds “Clean Range” zones only when three timeframes agree (default: M30/M15/M5), then waits for a single, high-quality M5 confirmation to print a BUY/SELL label. It’s fast, simple, and ruthlessly focused on precision.
What it does
Clean Range zones: Drawn from the last completed M30 candle only when M30/M15/M5 align (all green or all red).
Size filter (pips): Ignore tiny, low-value ranges with a configurable minimum height (auto-pip detection included).
Extend-until-mitigated: Zones stretch right and “freeze” on first mitigation (close inside or close beyond, your choice). Optional fade when mitigated.
Laser M5 entries (one per box):
Red M5 bar inside a green zone → SELL
Green M5 bar inside a red zone → BUY
Prints once per zone on the closed M5 candle—no spam.
Quality of life: Keep latest N zones, customizable colors, optional H4 reference lines, alert conditions for both zone creation and entries.
Why traders love it
Clarity: Filters chop; you see only aligned zones and one clean trigger.
Speed: Designed for scalpers on FX, XAU/USD, indices, and more.
Control: Tune lookback, pip threshold, mitigation logic, and visuals to fit your playbook.
Tips
Use on liquid sessions for best results.
Combine with your risk model (fixed R, partials at mid/edge, etc.).
Backtest different pip filters per symbol.
Disclaimer: No indicator guarantees profits. Trade responsibly and manage risk.
